Hematologic and Lymphoid
Jump to navigation
Jump to search
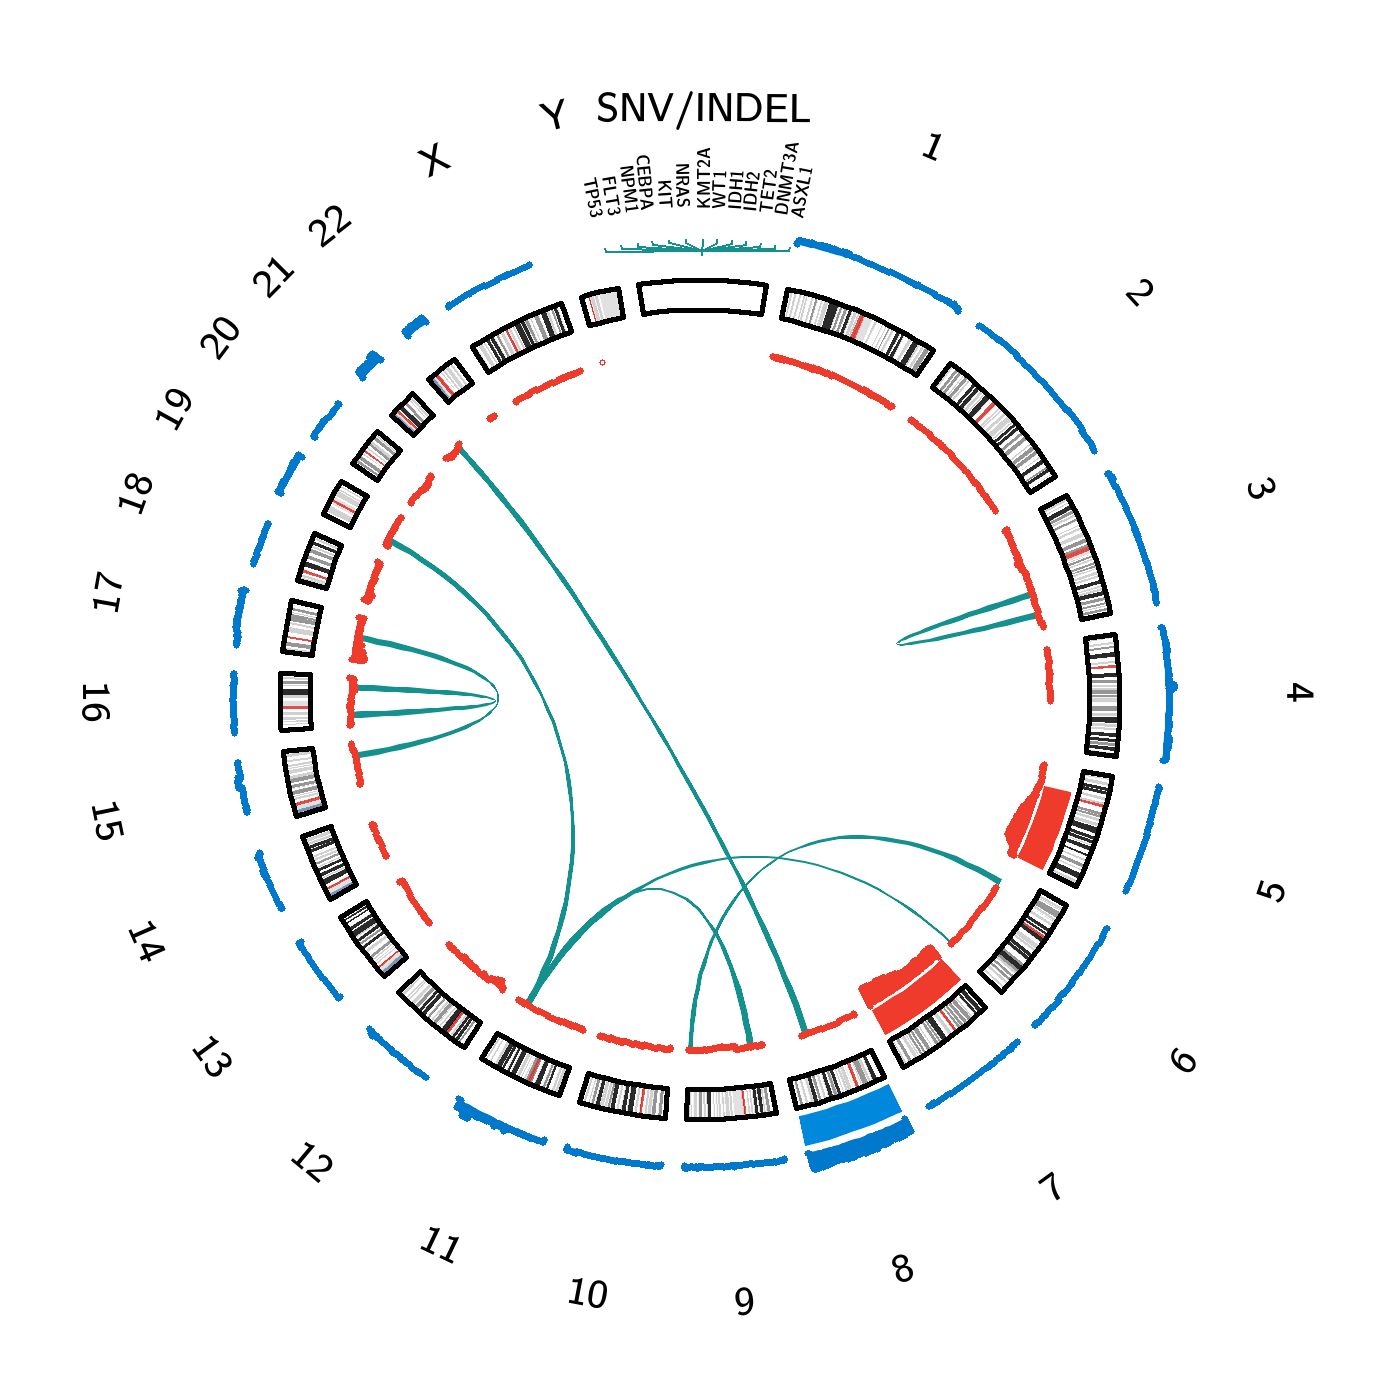
AML Circos Plot. Click on interactive content to be linked to related pages. Lines = Structural Rearrangements (between connected chromosomes); Gene Names = Gene-Specific Alterations; Red Bars = Copy Number Losses; Blue Bars = Copy Number Gains. The thickness of the red and blue bars correlates with the corresponding copy number change frequency.
- Acute Myeloid Leukemia (AML)