Difference between revisions of "Hematologic and Lymphoid"
Jump to navigation
Jump to search
| [unchecked revision] | [unchecked revision] |
| (One intermediate revision by the same user not shown) | |||
| Line 1: | Line 1: | ||
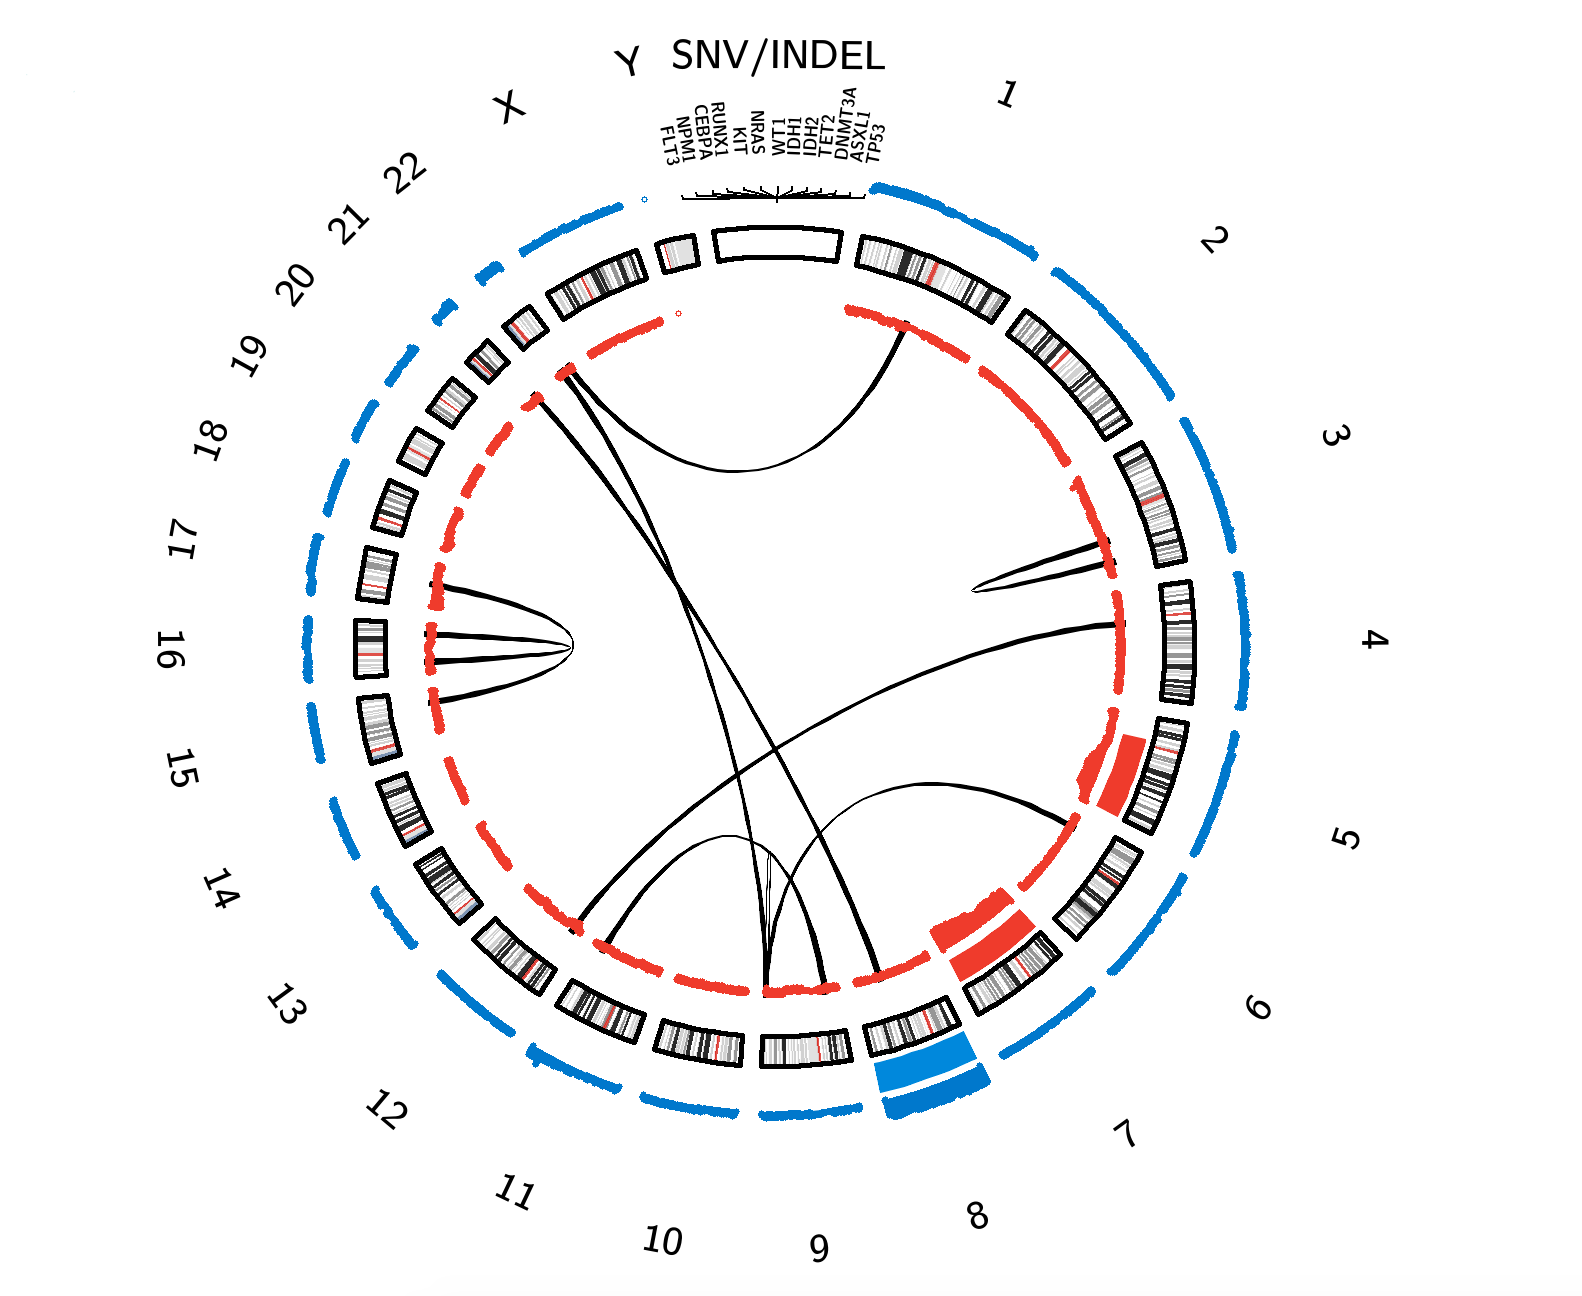
| − | [[File: | + | [[File:Circos_AML.new.png|1000px|AML|link=https://ccga.github.io/circos/AML.circos.merged.html|center| '''AML Circos Plot. Click on interactive content to be linked to related pages. Lines = Structural Rearrangements (between connected chromosomes); Gene Names = Gene-Specific Alterations; Red Bars = Copy Number Losses; Blue Bars = Copy Number Gains. The thickness of the red and blue bars correlates with the corresponding copy number change frequency (specific interactive copy number information in the plot.ly graph below).''']] |
| − | + | <br> | |
| − | + | '''AML Circos Plot'''. Click on interactive content to be linked to related pages. Lines = Structural Rearrangements (between connected chromosomes); Gene Names = Gene-Specific Alterations; Red Bars = Copy Number Losses; Blue Bars = Copy Number Gains. The thickness of the red and blue bars correlates with the corresponding copy number change frequency. | |
Latest revision as of 20:35, 29 July 2018
AML Circos Plot. Click on interactive content to be linked to related pages. Lines = Structural Rearrangements (between connected chromosomes); Gene Names = Gene-Specific Alterations; Red Bars = Copy Number Losses; Blue Bars = Copy Number Gains. The thickness of the red and blue bars correlates with the corresponding copy number change frequency.